Intro
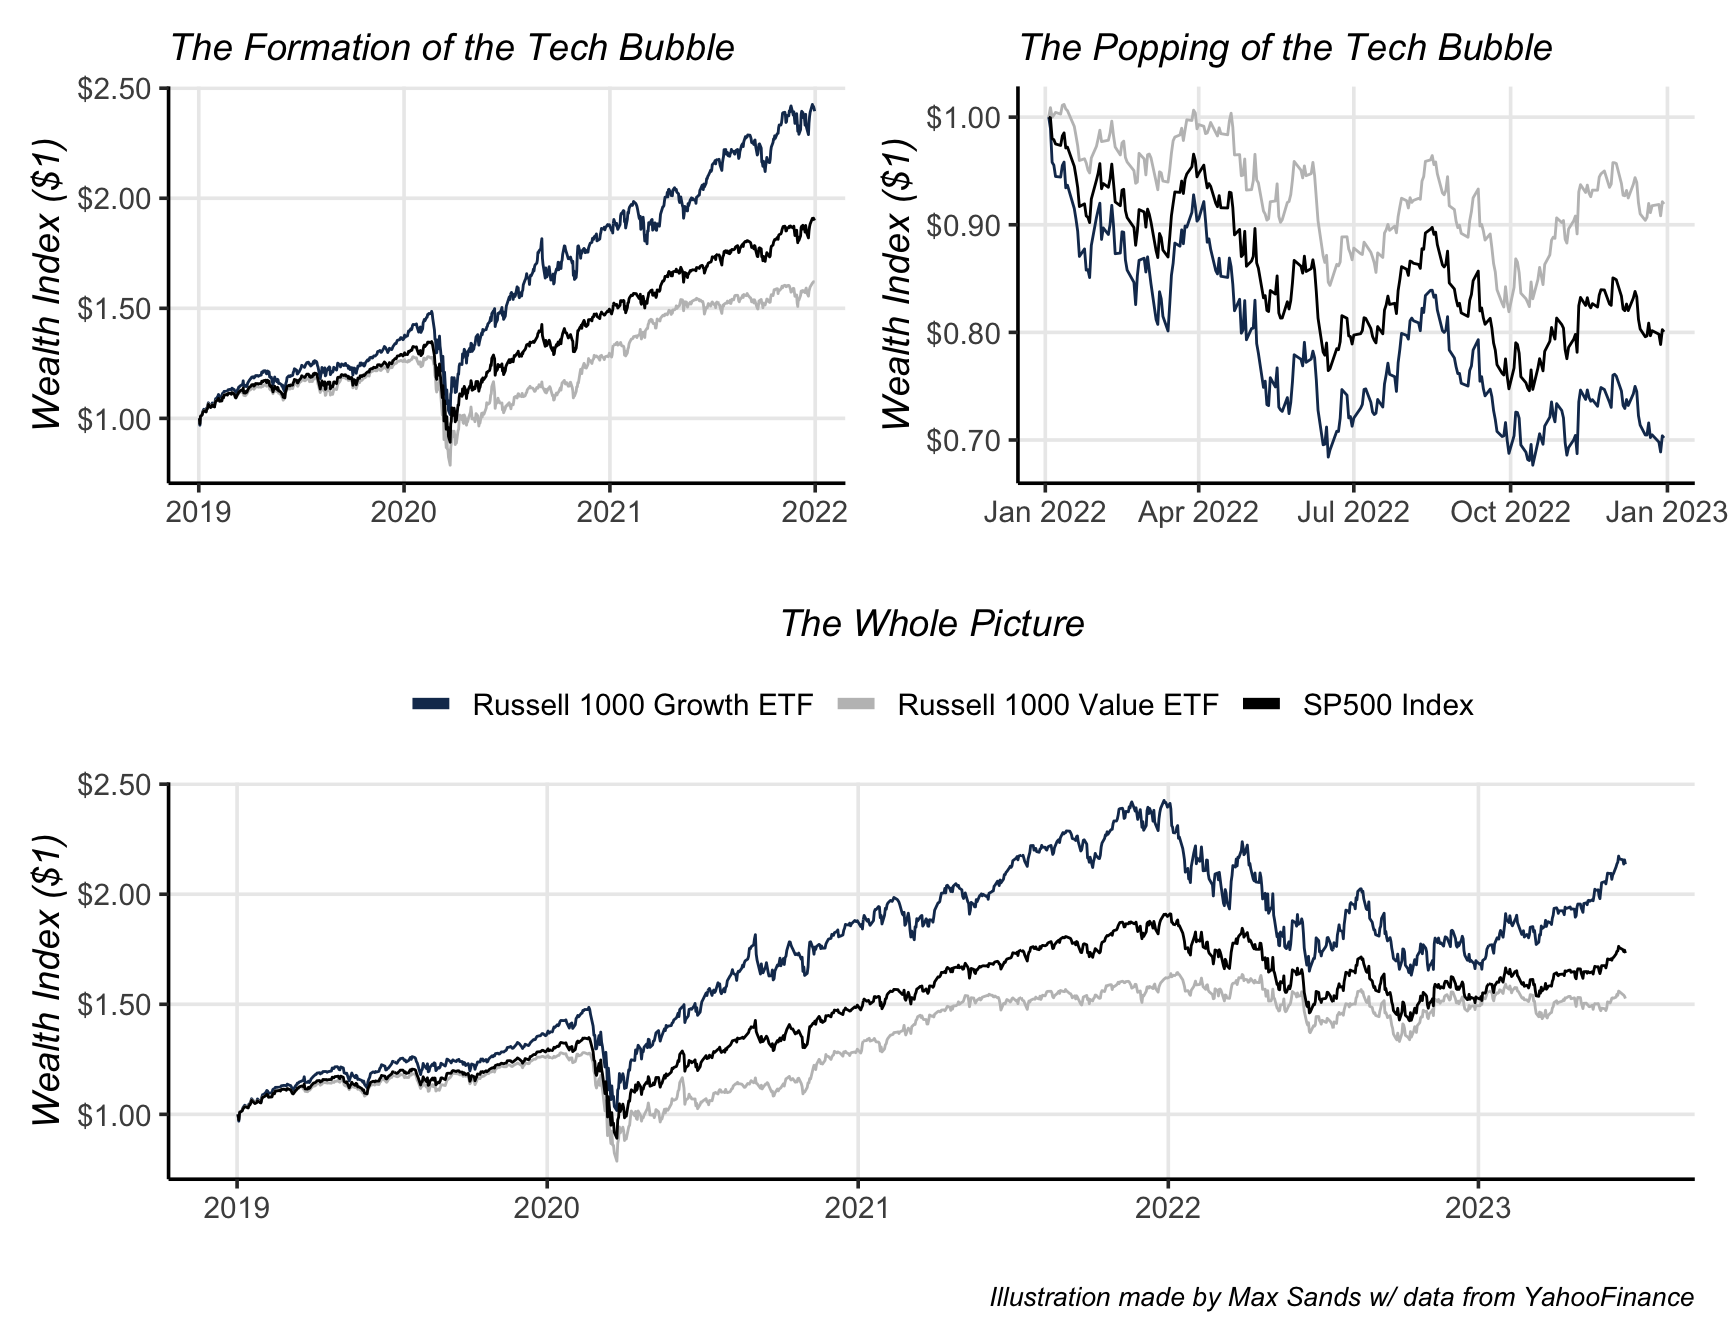
In 2022, the U.S. equity markets - inflated by exorbitant Quantitative Easing and financial stimulation due to the Covid-19 pandemic - suffered as the bubble eventually popped. As expected, the areas that had seen the most rapid increase in prices (in this case, the ‘Growth’ sectors like Tech) also saw the most severe draw-down:
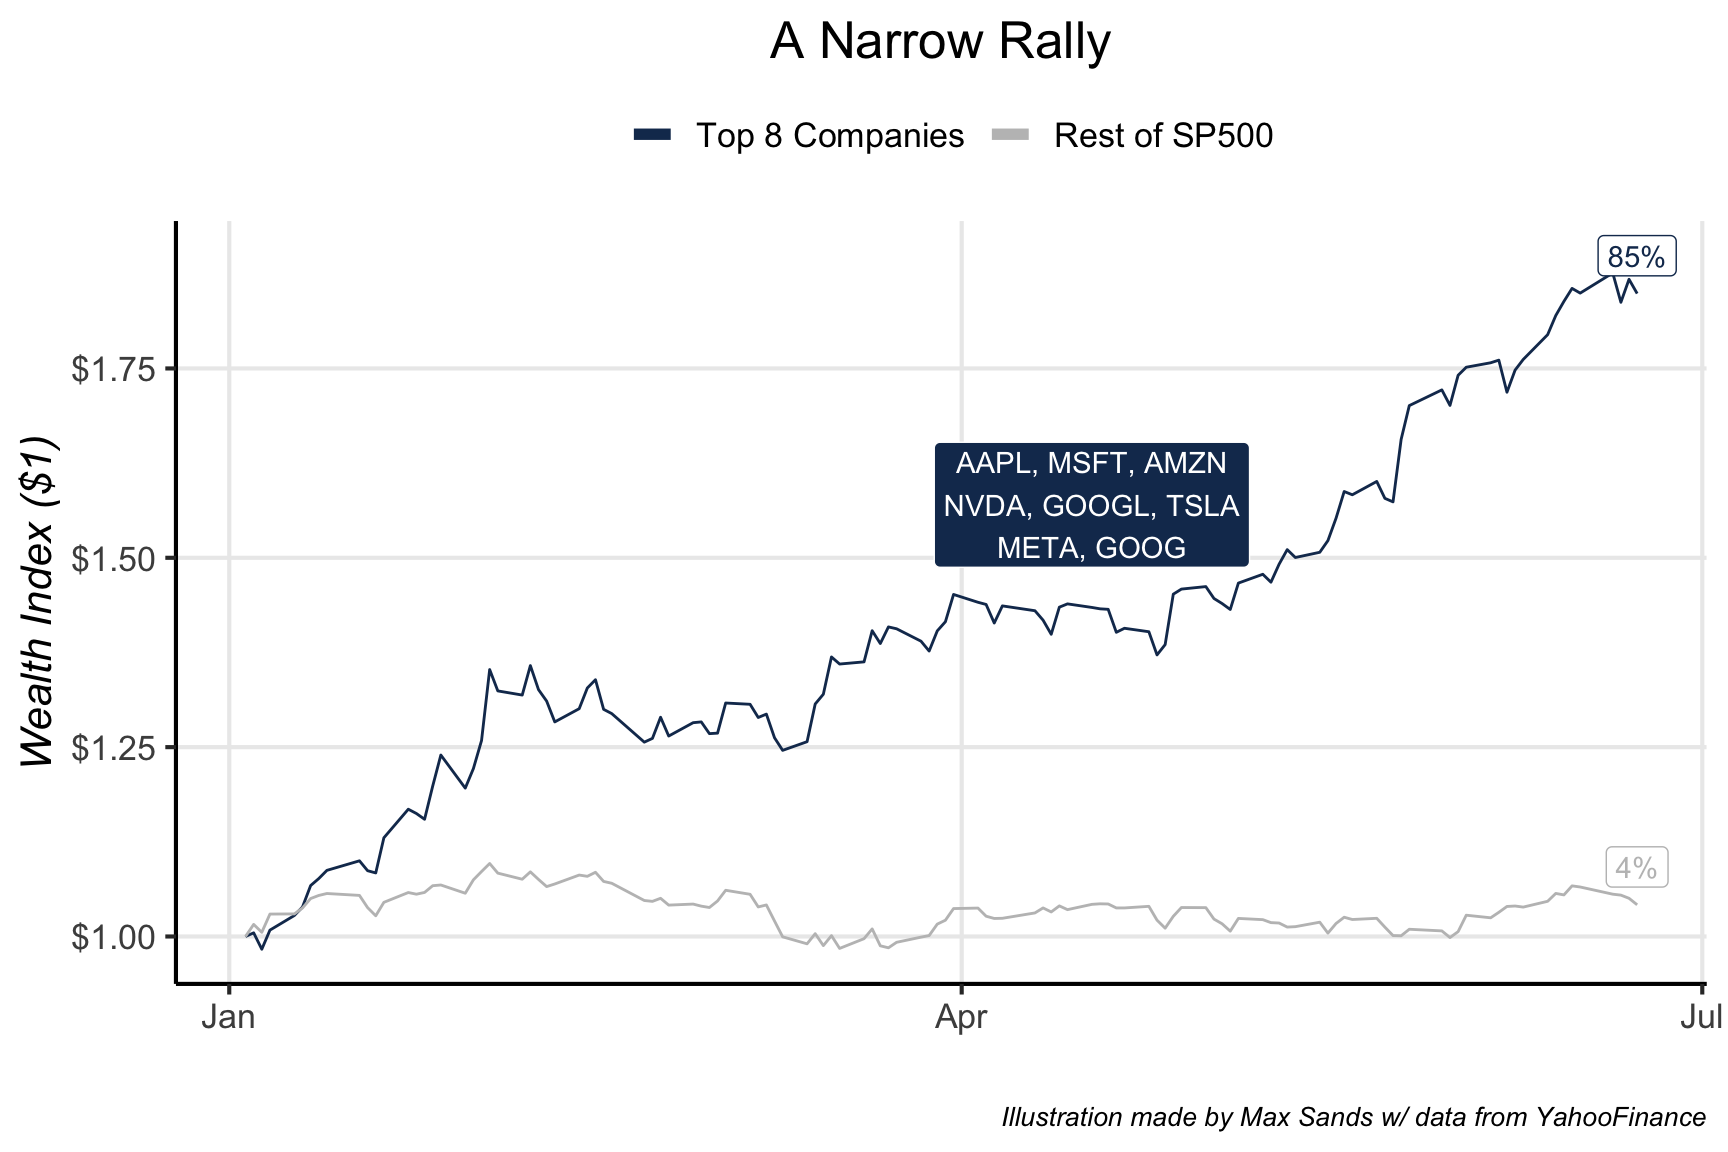
However, the start of 2023 marks the beginning of an odd rally in U.S. Equity markets. The top 8 names in the SP500 have rallied significantly since the start of the year, whereas the remaining companies in the SP500 have flat-lined.
This begs the question: how long can the rally continue, and what does the medium-term future look like for U.S. Equities?
The Bear Case
While there are many reasons that may bolster the argument for a bear case, we will cover the following two in-depth:
- Relative Valuations & the Equity Risk Premium: Valuations are still high and the risk-to-reward ratio for Equities is not attractive, especially when compared to other assets…
- Macroeconomic Uncertainty: The future macroeconomic landscape is hazy; consensus indicates a near-term recession, and relations between U.S. & China are becoming increasingly tenuous…
Relative Valuations & ERP
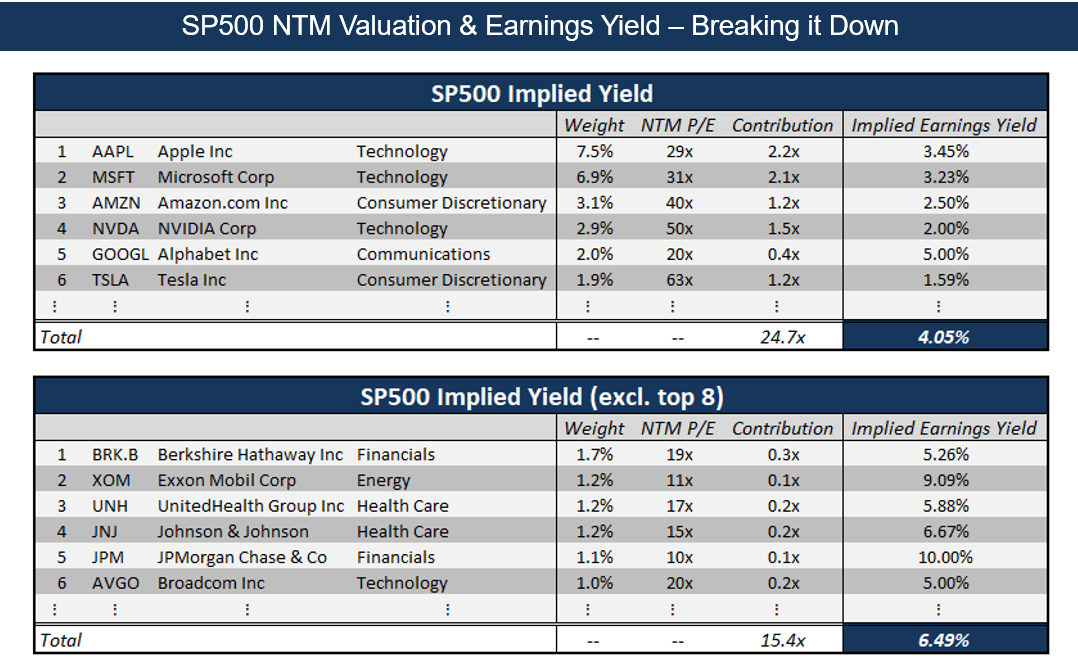
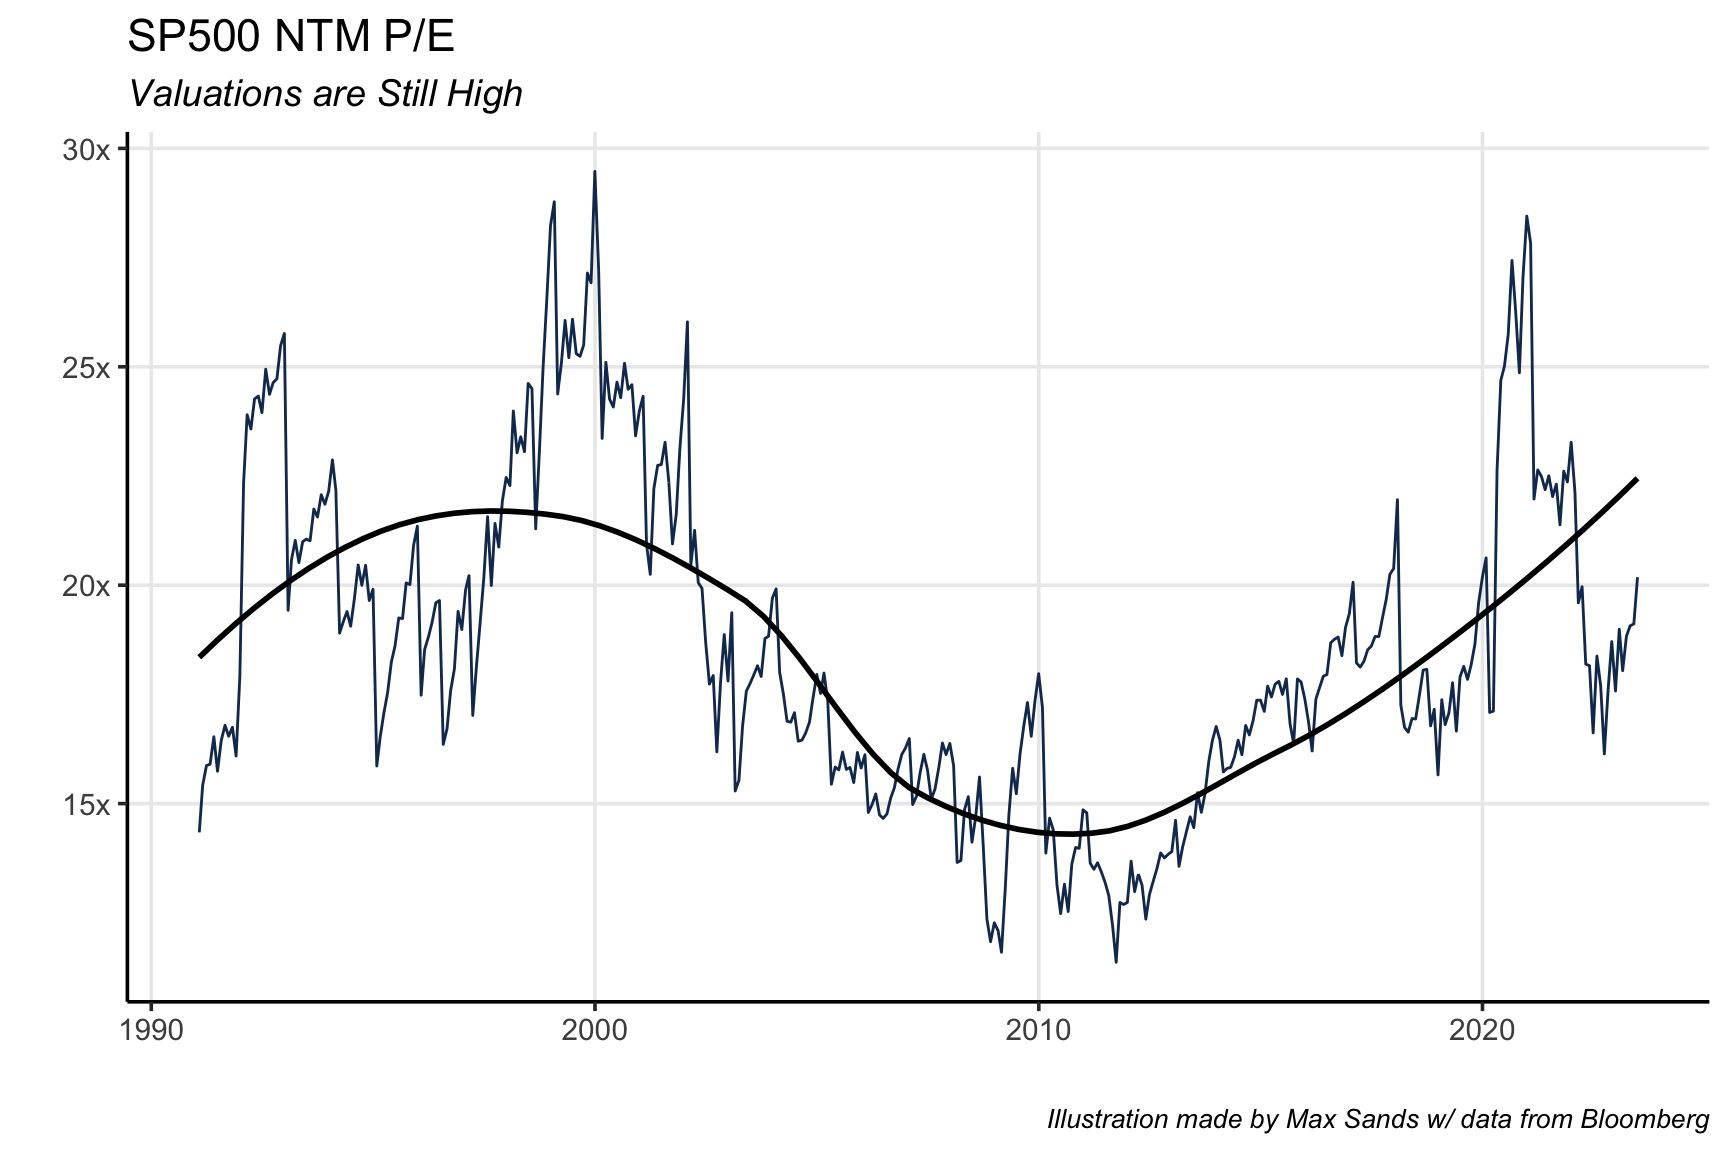
Perhaps the most clear argument for a bear case is that valuations are still high. If we perform a simple breakdown of the valuations for the companies in the SP500, we notice that the implied yield is relatively low. Even if we exclude the top 8 companies, the implied yield of 6.5% is low in relation to the current 1-year TBill rate of approximately 5.3%.
Therefore, let’s compare the implied yield on Equities to the yields on High Yield Debt and Investment Grade Debt across different hypothetical senarios:
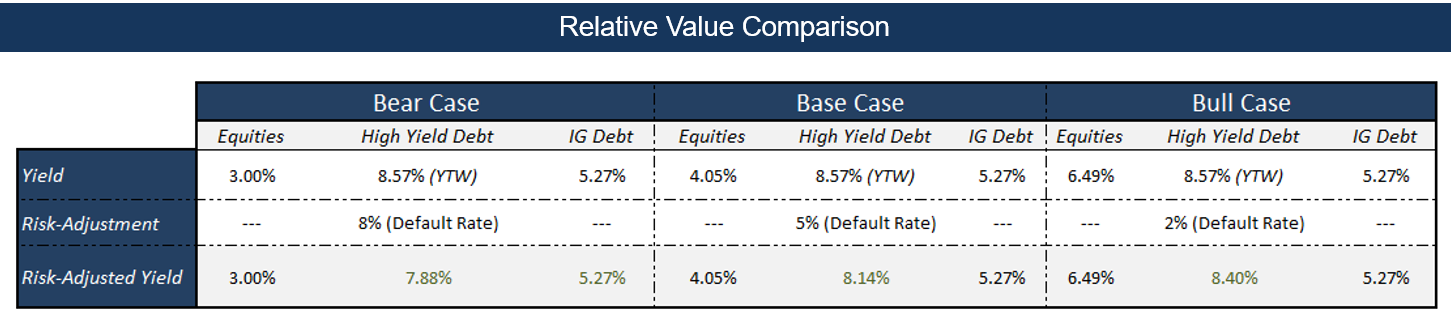
When comparing nominal yields, we notice that High Yield Debt and 1-year TBills appear much more attractive than Equities. Even after adjusting the Yield-to-Worst with hypothetical default rates, High Yield Debt seems to be a suitable alternative to Equities.
However, many individuals would refute the above by claiming that, while, in the long-run, implied yield may equate to long-run equity returns, this one-to-one relationship has not held in recent history**.
**This may be indicative of the current growth tilt in U.S. Equity markets in recent history - especially when considering the Return Yield-Gap Factor increases when looking at the past 30 years only…
In light of this rebuttal, let’s adjust the implied yield with an artificial Return Yield-Gap Factor:
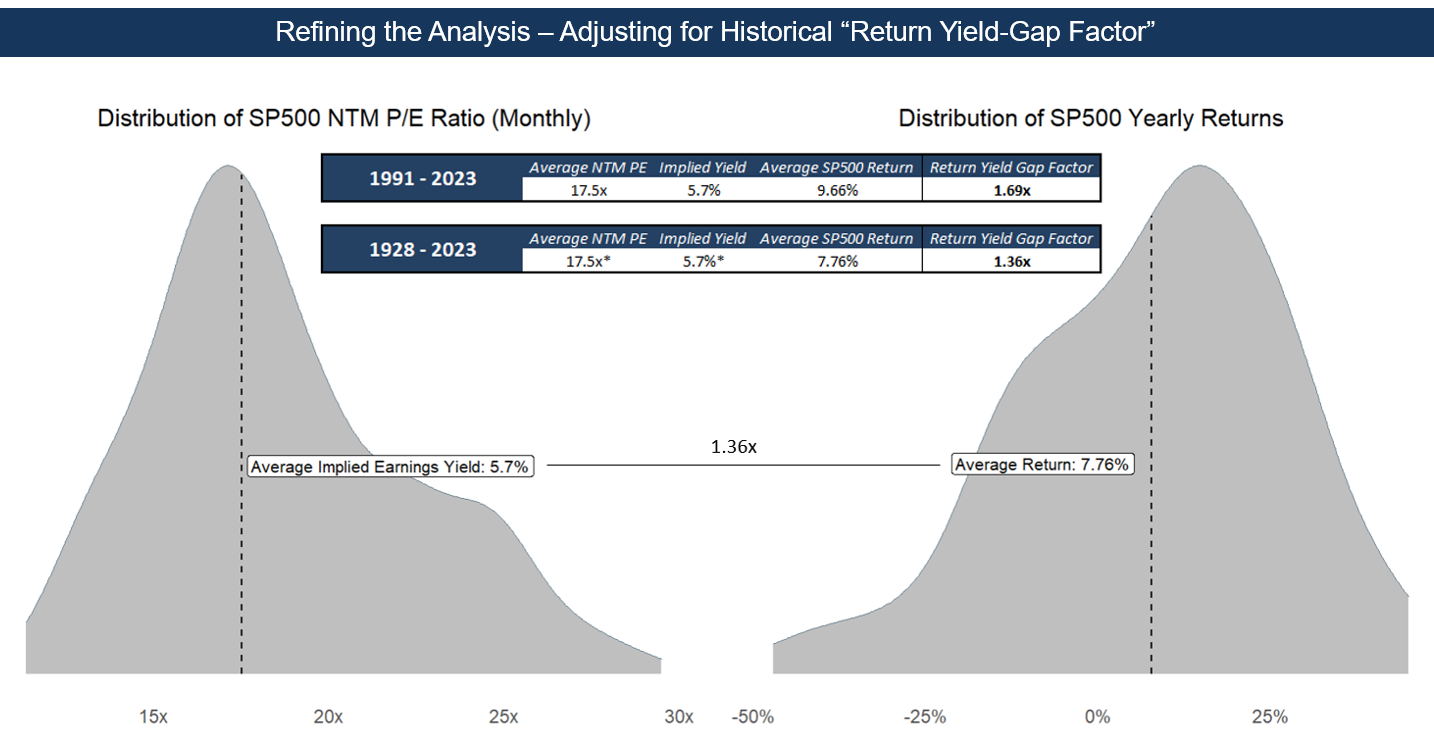
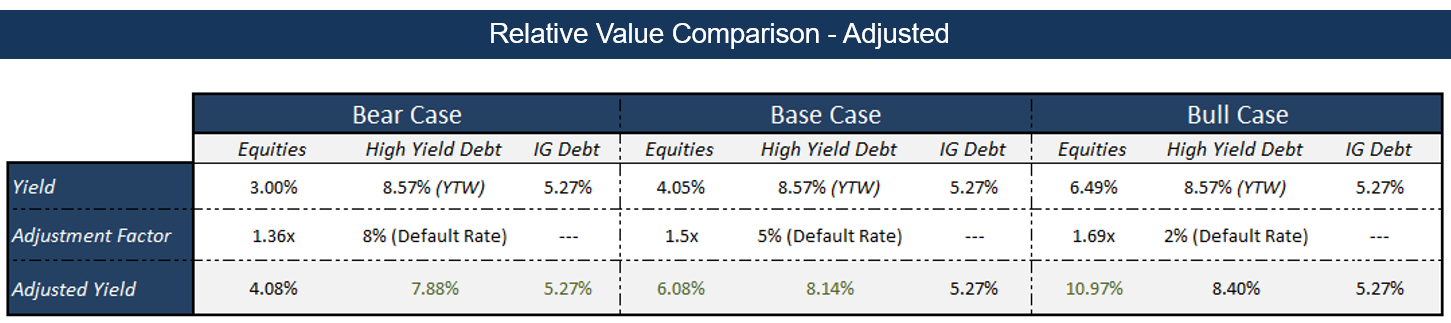
Even after adjusting for the artificial Return Yield-Gap Factor we notice that Equities only seem attractive in the most optimistic scenario where we use:
- The Implied Yield excluding the top 8 companies
- The most generous
Return Yield-Gap Factorof 1.69x which implies that we expect a similar growth economy to that of the past 30 years
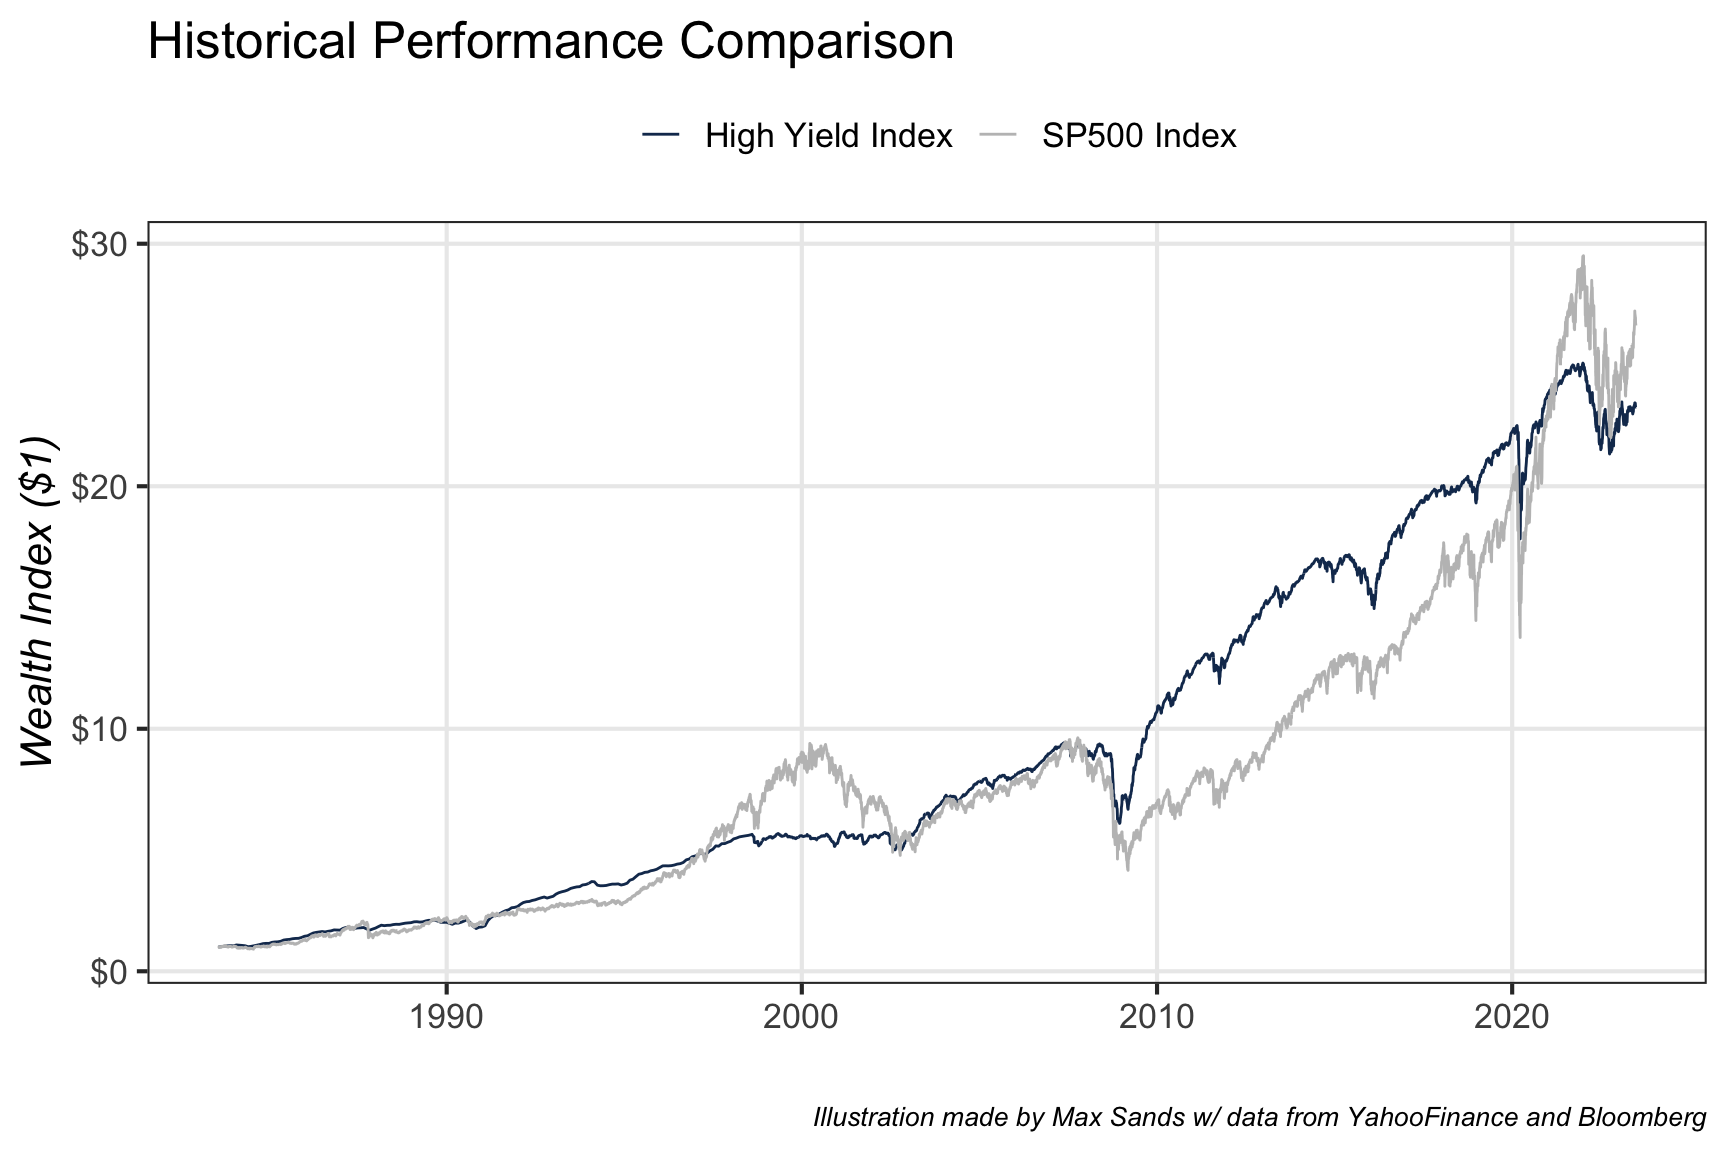
For all other scenarios, High Yield Debt and Investment Grade Debt appear to be a more rewarding asset class, especially when considering each asset’s risk profile. The illustration below compares U.S. Equity performance to that of U.S. High Yield Debt - performance has been relatively similar, with less volatility occurring in debt markets:
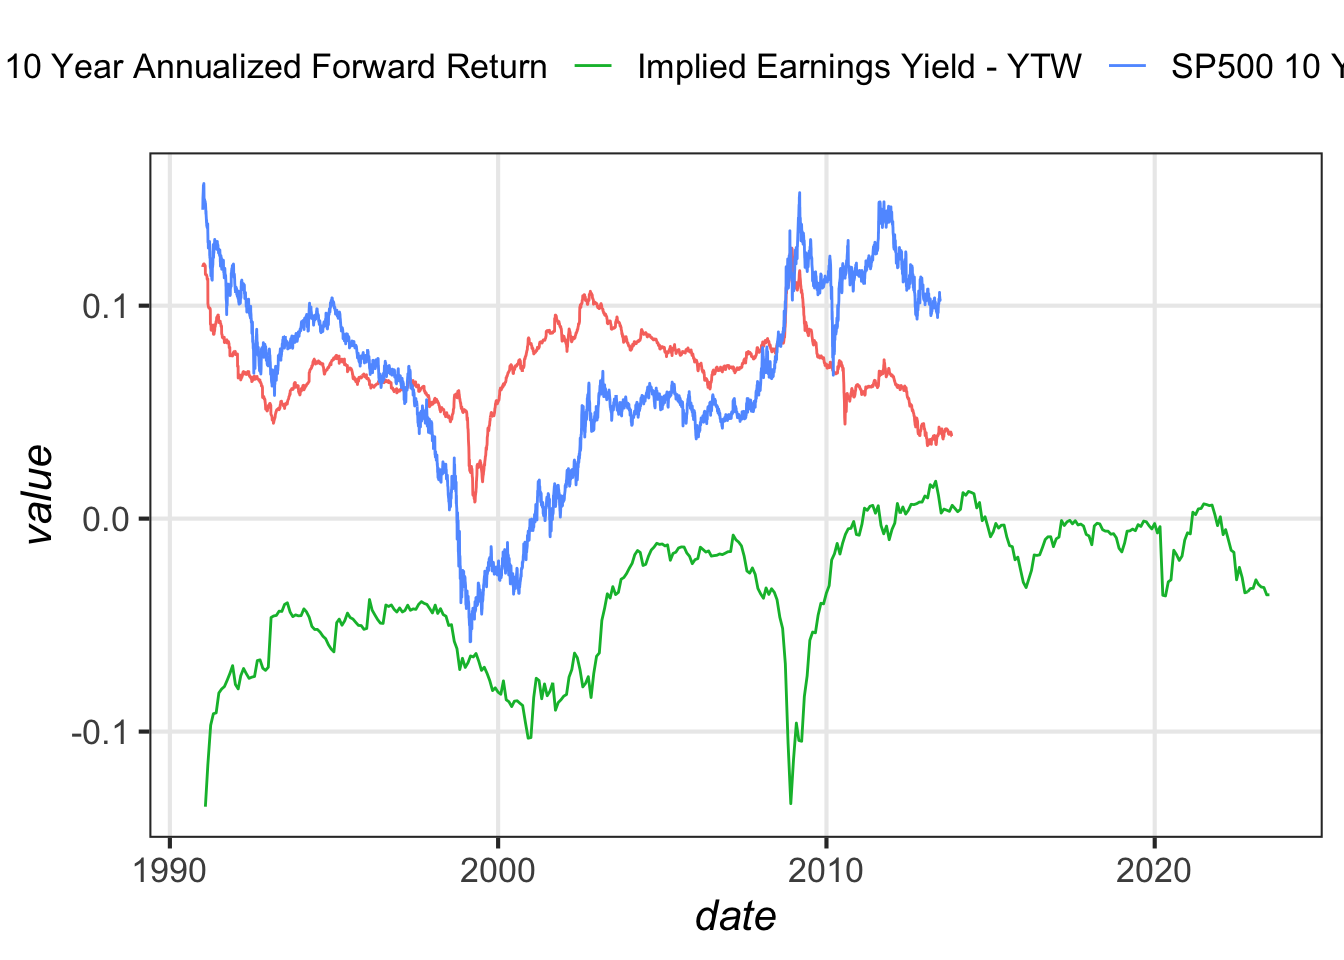
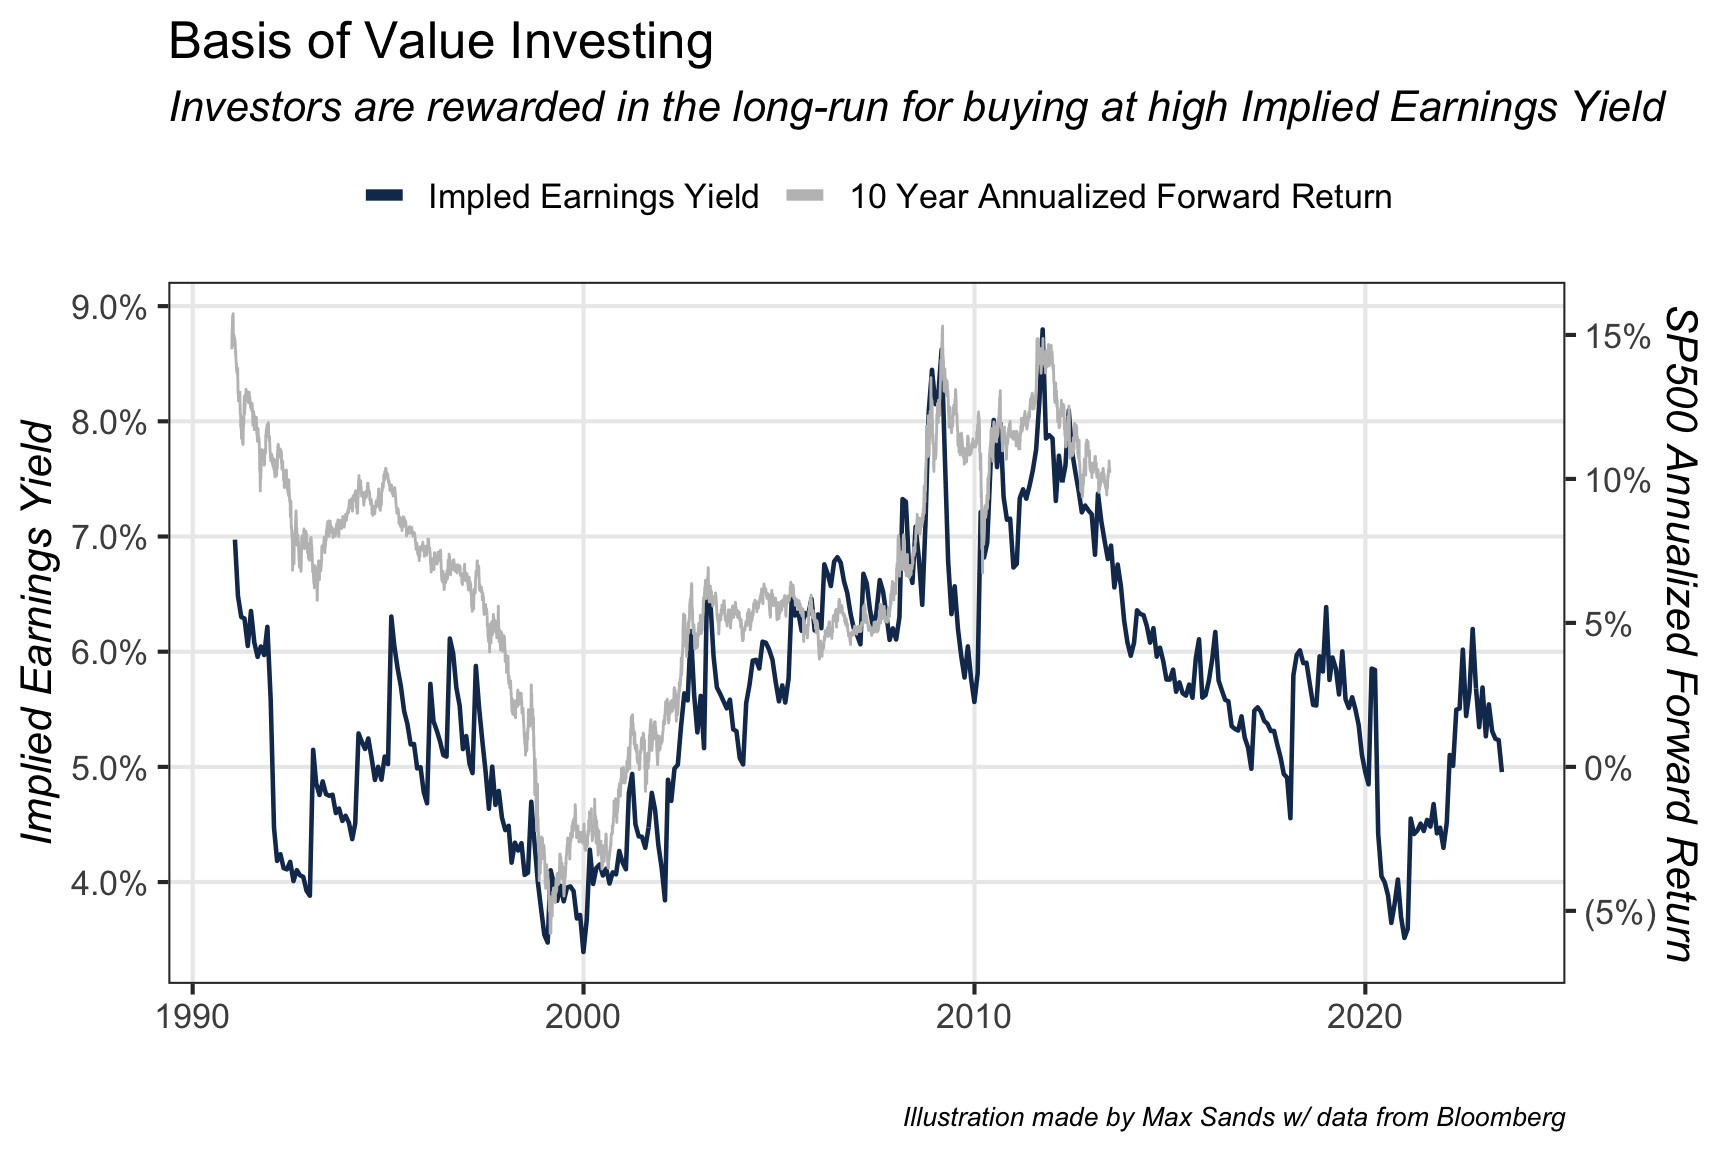
Moreover, we note that, historically, value investing has consistently delivered strong returns; as we can see below, investors are typically rewarded for investing when implied earnings yields are high (i.e. at low valuations):
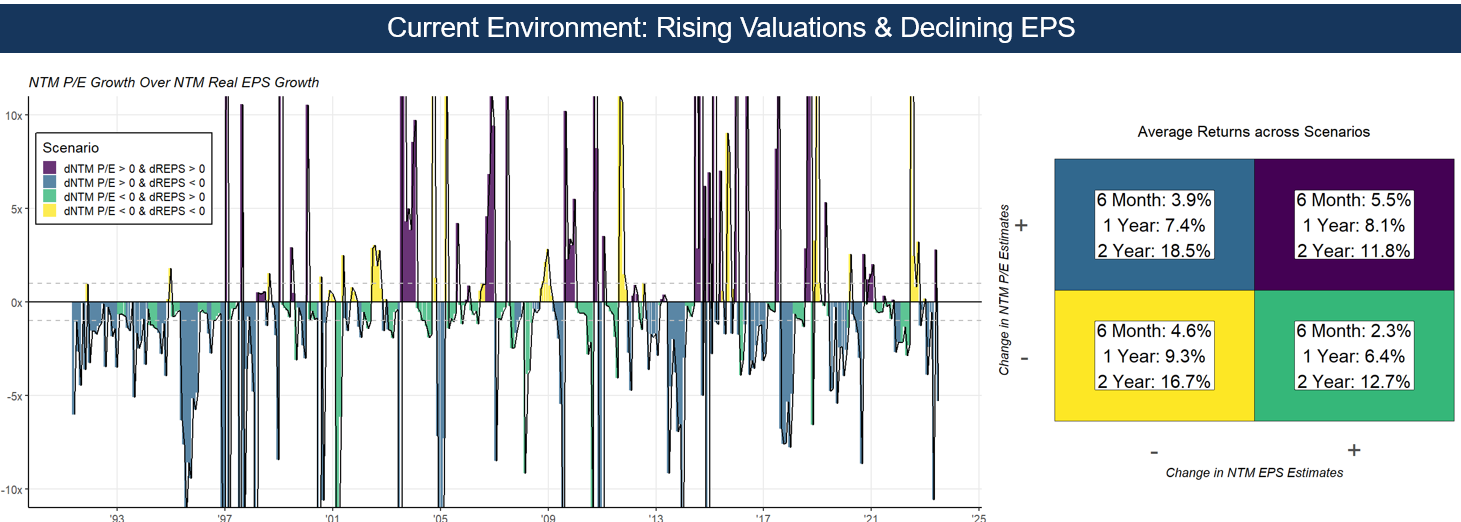
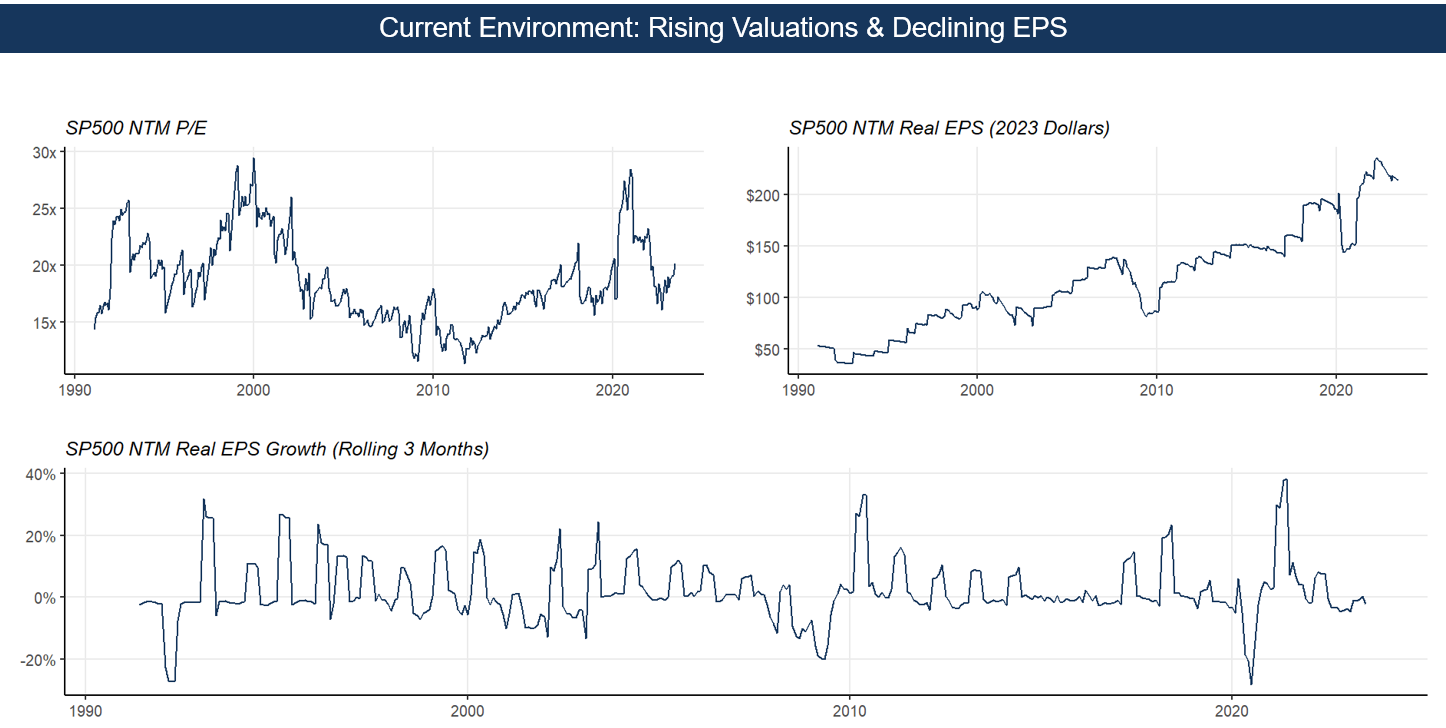
In addition to high valuations, the current earnings environment is not extremely favorable. From the chart below, we can wee that while valuations have increased since the start of 2023, analyst consensus NTM earnings estimates (adjusted for inflation) …
have declined.
If we consider that there are 4 investing environments that can occur:
- Valuations increase & Real Earnings Estimates increase
- Valuations increase & Real Earnings Estimates decrease
- Valuations decrease & Real Earnings Estimates decrease
- Valuations decrease & Real Earnings Estimates decrease
and investigate how the SP500 behaves in these environments, we can see that…